Main View
The main view of the Event Log provides a comprehensive overview of all audit events, which can be filtered and sorted to meet your needs.
Filter Bar
The filter bar provides several tools to filter out the events displayed in the log table.

Search Bar
- Allows for text-based searches across all table columns.
- Supports free-text queries without requiring special syntax.
- Results are updated after pressing
Enter
Date Filter
Enables filtering of events based on their time of occurrence.
| Available Option | Description |
|---|---|
| Single Date | Allows you to select a date from the past or simply today / yesterday by clicking on the provided options. |
| Date Range | Allows you to filter the event log from and to a specific date and/or time as well as for the last minutes and hours per your choosing. |
| Week | Allows you to filter the event log by this or last week. |
| Month | Allows you to filter the event log by this or last month. |
| Entire History | Allows you to view the whole history within the event log from first log until the most recent one. |
State Filter
Represents the execution status of events, indicated by icons.
| State | Description |
|---|---|
| Success | The event completed without any issues. |
| Warning | The event completed, but with non-critical issues that may require attention. |
| Error | The event failed to complete due to an error. |
| Running | The event is currently in progress. |
| Skipped | The event or a stage within it was intentionally bypassed. |
| Pending | The event is waiting for a trigger or resource to begin execution. |
You can toggle any combination of these state filters to display only the events that match your criteria.
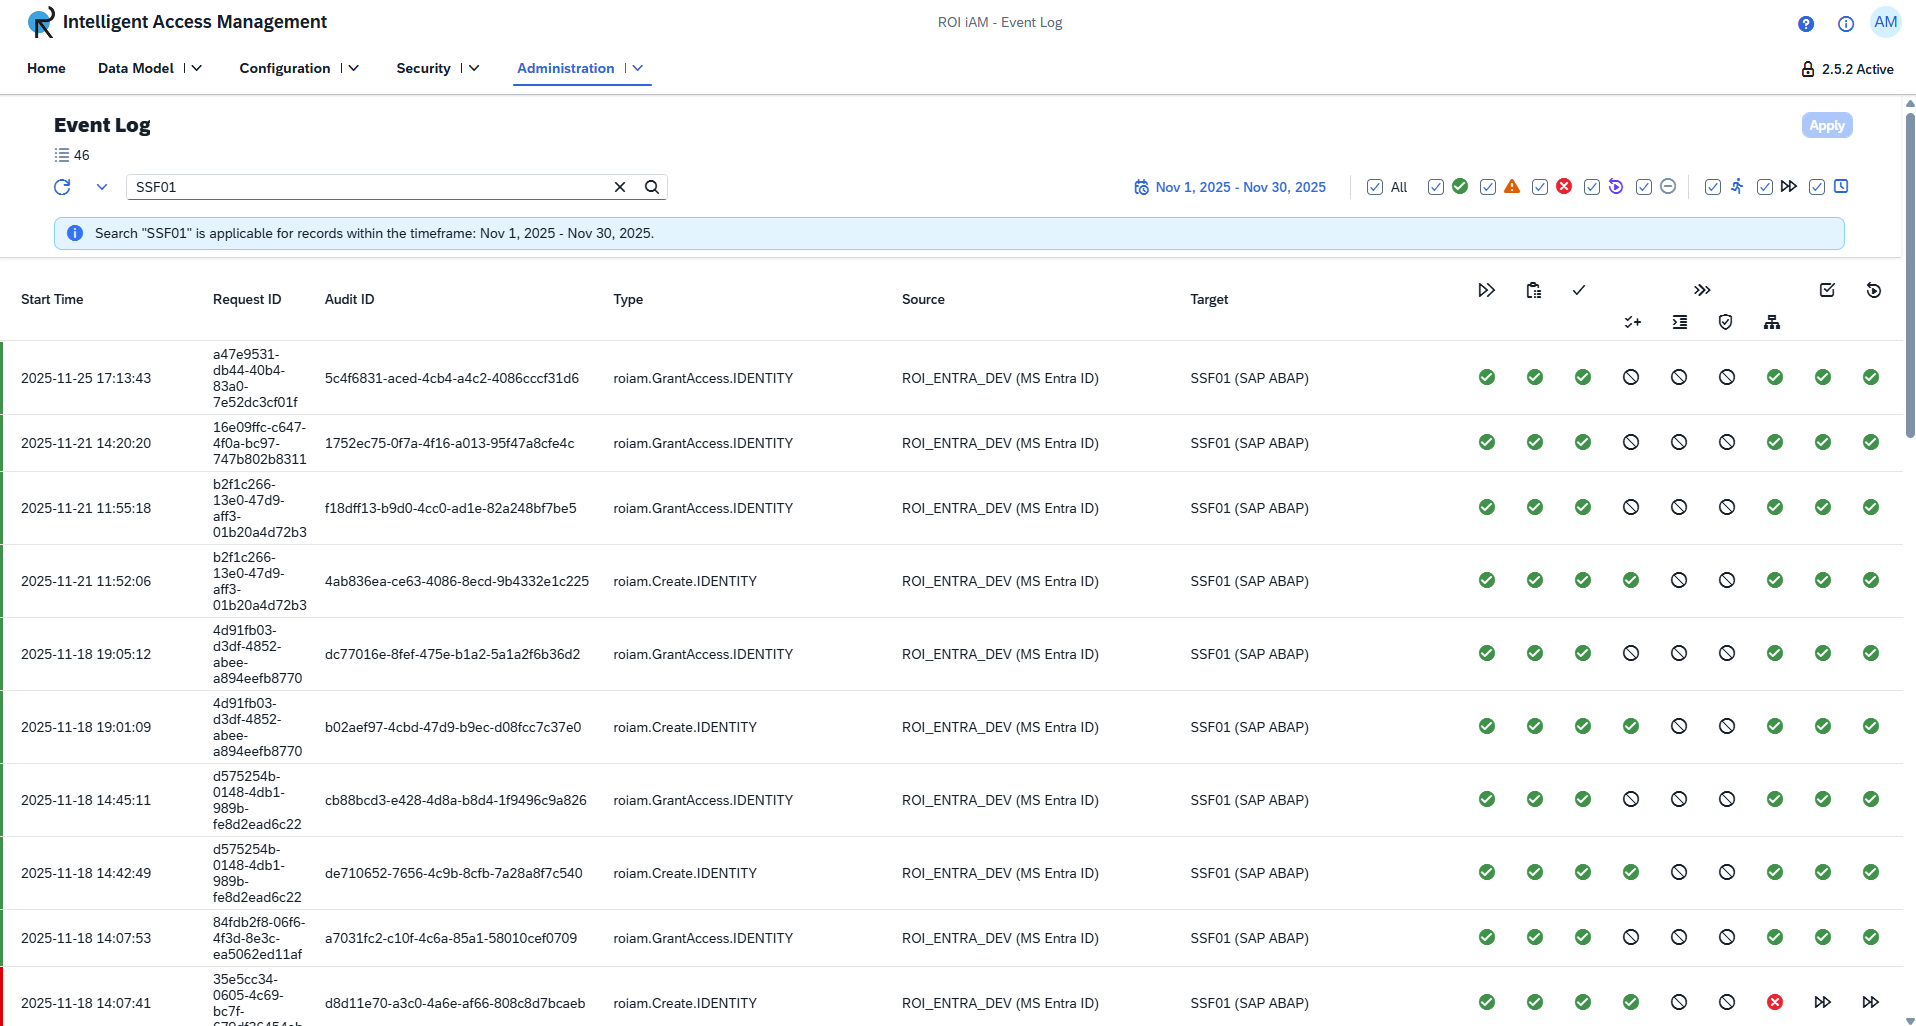
Event Log Table
The main table lists all audit events that match the currently applied filters.
Table Columns
| Column | Description |
|---|---|
| Start Time | Timestamp indicating when the event began. |
| Request ID | Identifier for the incoming request that triggered the event. |
| Audit ID | A unique identifier assigned to the audit record. |
| Type | Describes the action performed (e.g., roiam.Create.IDENTITY). |
| Source | The originating system or module (e.g., ROI_GRC_DEV (SAP GRC)). |
| Target | The destination system or object affected by the action. |
| Stage Icons | Visual indicators representing each step of the event's lifecycle. |
Row Color Indicators
A colored strip on the left edge of each row provides an at-a-glance indication of the event's overall status:
- Purple → Retried
- Orange → Warning
- Red → Error
- Green → Successful
- Grey → Cancelled
Event Stages
An event's lifecycle is visually represented by a sequence of stage icons, which appear from left to right:
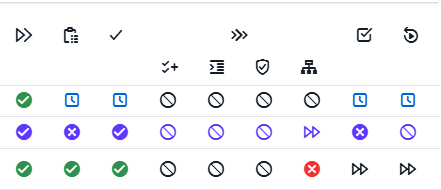
- Initialize
- Prepare to Execute
- Ready to Run
- Runtime (contains sub-stages):
- Enrich
- Source
- Validate
- Target
- Execute
- Callback
Each stage can have one of several states.
States
The state of each stage corresponds to the icons shown in the State Filter section above.